HYPERSTELLAR

Industry report · September 2026 · For infrastructure leaders

Download Hyperstellar's State of IT Infrastructure 2026-2027: twelve forces, the physical limits that now pace growth, unit economics on accepted output, and a five-quarter capacity roadmap for infrastructure leaders.

15 pages · Twelve-force dashboard · 145 verified sources

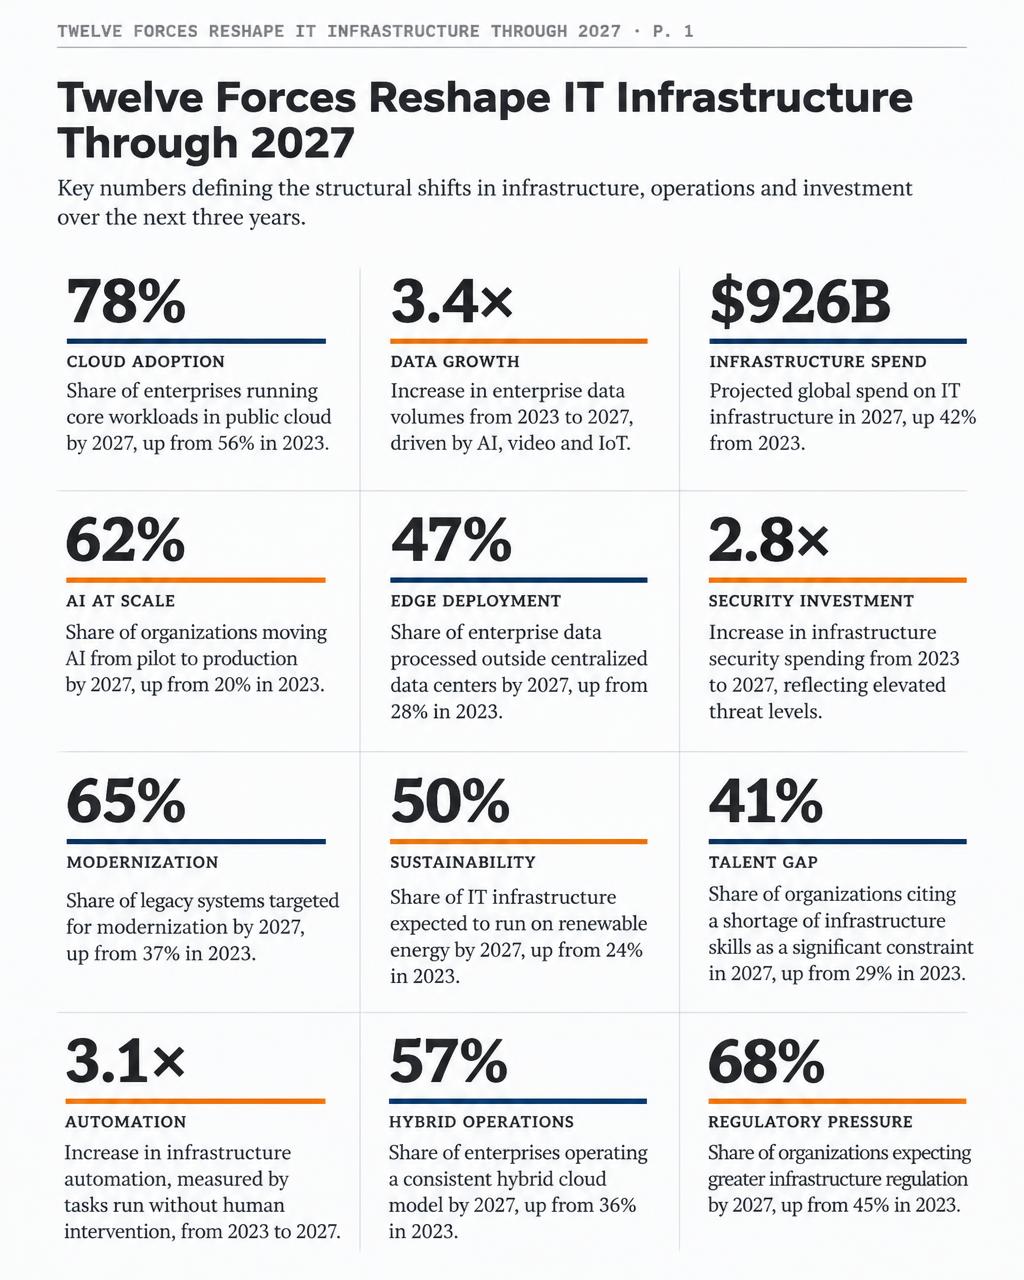
A page from the report titled Twelve forces reshape IT infrastructure through 2027, showing a dashboard of twelve forces with a headline figure, a source, and a pressure rating for each
From the report · State of IT Infrastructure · September 2026 · 15 pp. · Page 1 of 3

Inside the report

Fourteen sections, one page each, every figure traceable.

Built as a reference rather than a single read: a twelve-force dashboard, the physical limits pacing growth, the rack-scale stack, six enforced controls, and a scorecard for the five quarters ahead.

01

Data-center capital passes $1 trillion in 2026, and physical limits now pace growth more than capital does.

Twelve forces rated for pressure through 2027, annualized investment estimates from $500 billion to $3 trillion by publisher, and eight constraints with measured evidence, severity, and forecast relief years.

Sections 01-04 · pp. 1-4
Summary to limits
02

Data gravity, power, and jurisdiction govern placement, and near-zero core vacancy pushes growth outward.

A placement map by location and ownership domain with its sovereign and latency-bound zones, colocation vacancy by market, and growth moving from core campuses to secondary metros and edge nodes.

Sections 05-06 · pp. 5-6
Placement and edge
03

The unit of AI capacity is now the rack-scale system, and automation pays only when the lifecycle closes.

Seven stack layers with a measured anchor for each, the two control layers that decide productivity, and the six-step platform lifecycle with the numbers on where it breaks.

Sections 07-08 · pp. 7-8
Stack and operations
04

Unit economics now run on accepted output, and operational trust is a stack of six enforced controls.

An illustrative build-up of cost per productive GPU-hour from the index rate, published discounts against on-demand, six controls with their measured failure modes, and the major outages of 2025 and 2026.

Sections 09-10 · pp. 9-10
Economics and trust
05

Utilization hides six metrics, and a compute market extends allocation across owners.

Nine capacity states from installed to settled, the ten functions of a compute market, a six-stage roadmap across five quarters, and a capacity scorecard with measured baselines and 2027 target bands.

Sections 11-14 · pp. 11-14
Utilization to roadmap

Why this matters now

Idle where it is installed. Scarce where it is wanted.

Record capital, near-zero primary-market vacancy, and 40% activity on the busiest clusters describe the same year. Output per GPU-hour, per dollar, and per watt becomes the governing measure.

~40%

median streaming multiprocessor activity on LLM clusters that report 97% to 99% device utilization.

Measured.
Shanghai AI Lab, 4,704 A100 GPUs, March to August 2023. Same clusters, both figures.

1.4%

North American primary-market colocation vacancy, with 80.4% of construction preleased before it is built.

Measured.
CBRE, H1 2026. Northern Virginia is 0.2%.

>$1T

global data-center capital spending in 2026, the largest infrastructure project ever attempted.

Forecast.
Dell'Oro for the spending figure, Gartner for the characterization. Scope differs by publisher.

About the report

Written for infrastructure leaders who answer for output per GPU-hour, per dollar, and per watt.

State of IT Infrastructure 2026-2027 is a fourteen-section industry report on the year the buildout turns from capacity acquisition to capital productivity. Each section is one page: a declarative headline, one infographic, and the measured evidence behind it.

Every figure carries its status as the source states it: measured, estimate, forecast, or scenario. Pressure ratings, severity ratings, and 2027 target bands are analytical synthesis and are labeled as such. The full citation list of 145 sources, with publisher, title, date, and URL, is in the companion sources appendix.

CAPACITY STATESHARE OF INSTALLED HOURS, ILLUSTRATIVEInstalled100Healthy and reachable95Available88Qualified and policy-eligible80Listed72Cleared and contracted68Allocated65Productive3035 POINTS LOST AFTER ALLOCATIONSettled28
Nine capacity states, as the report defines them · p. 11 · Widths are illustrative

Hyperstellar is an early-stage company and deliberate about what it claims. The report presents Hyperstellar's operational point of view and no investor framing. Illustrative figures, bar widths, and target bands are analytical synthesis, not measured results, and the research cutoff is September 8, 2026.

Put a number on your idle hours.

Read the report, then talk with Hyperstellar about measuring, classifying, and activating the capacity your estate already holds.

Talk to Hyperstellar

Questions

Before you download.

Who is this report written for?

Infrastructure, IT, AI, data, data center, cloud, network and edge, and finance leaders who plan, fund, or operate compute capacity through 2027, and who need one sourced picture of the forces, limits, and metrics that now govern it.

Is the report free?

Yes. We ask for a work email so we can deliver it and, occasionally, send Hyperstellar updates. You can unsubscribe at any time.

How was the report researched?

145 sources were researched and verified on September 8, 2026, the research cutoff: analyst and market research, technical papers and standards, practitioner surveys, filings and post-incident reports, and public bodies, exchanges, and provider pricing. Every figure carries its status as the source states it. Sources appear under the page they support, and the companion appendix lists every citation with publisher, title, date, and URL.

What does Hyperstellar do?

Hyperstellar Networks is building a peer-to-peer market for compute. Suppliers rent out capacity they already own and keep control of access, policy, and pricing; buyers compose attested capacity from more than one owner, on demand. The report is an industry read with no investor framing. Hyperstellar's operational point of view is labeled where it appears, and its platform, HV-OS, is in active product development.

Does the report cover 2027?

Yes. The report covers 2026 and 2027. Figures for 2027 appear as forecasts or scenarios, the relief years on the physical limits are forecast, and the 2027 target bands on the scorecard are analytical synthesis. The roadmap runs from Q4 2026 to Q4 2027.

Can I share the report with colleagues?

Please do. It is built to be forwarded: one page per section, a headline on each, and the sources under the page they support. Forward the PDF or send colleagues to this page.